$cat hitchcocks-recording.mdSteganographyHacknite 2.0
Hitchcock's Recording
A five-second audio clip with the flag drawn into its frequencies. A spectrogram turns the sound into a picture you can read.
$man hitchcocks-recording
What this one teaches:
- What a spectrogram is and how to read one, with time across and pitch up the side.
- Opening one in a free tool such as dcode's spectral analysis or Audacity.
Task description
Even the birds on the branch, or rather in this recording, know the solution to this task. But are they really birds, or is it something else?
The original was in Croatian; this is my translation. “Even the birds on the branch know” is a Croatian saying for something everybody knows. The title points at birds too: Alfred Hitchcock directed The Birds.
The recording
The task gives ptice.wav (“ptice” means birds), a stereo recording just under five seconds long. The question in the task is the hint. If the sounds aren’t really birds, the useful information isn’t in what they sound like, so it’s worth looking at the audio instead of listening to it.
What a spectrogram shows
Every sound is a mix of pitches, or frequencies, measured in hertz (Hz). Low hums are a few hundred Hz, birdsong and whistles are several thousand. A spectrogram is a picture of a recording that shows which frequencies are present at each moment:
- left to right is time,
- bottom to top is frequency,
- brightness is how loud that frequency is at that moment.
Normal speech or music makes blurry streaks. But if you generate a sound with exactly the right frequencies at exactly the right moments, you can draw shapes in the spectrogram, including letters. A sound made that way doesn’t resemble speech or music, which is presumably why the task calls it birds.
Looking at the recording
We used dcode’s spectral analysis tool: upload the WAV and it draws the spectrogram for you. If you’d rather use something on your own computer, Audacity is free. Open the file, click the track’s name to open its menu, and choose Spectrogram.
Either way, the flag is written across the picture in large letters, between about 3,000 and 7,000 Hz. Here’s the first second and a half, up to the opening bracket:
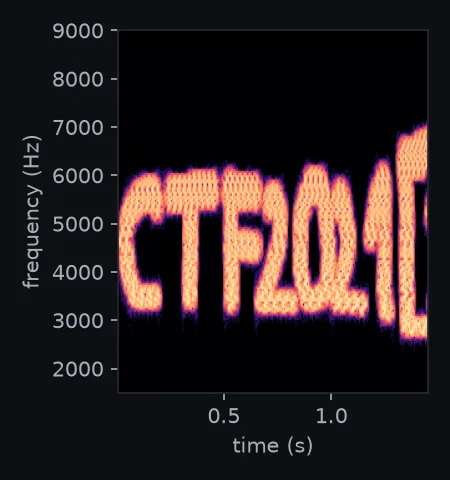
The digits follow in the remaining two and a half seconds, then the closing bracket, then silence. Reading them off the full spectrogram gives the flag.
$cat flag.txt reveal
CTF2021[330321035451]